Home -> News -> Media -> Beijing’s Bad-Air Days, Finally Counted
Beijing’s Bad-Air Days, Finally Counted
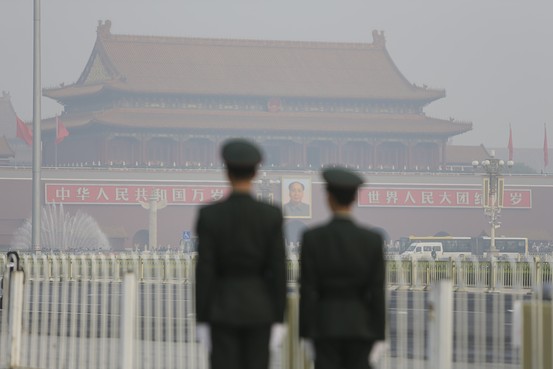
Thanks to the U.S. State Department, Beijing residents finally have the answer to one of the city’s greatest mysteries: How often is the air polluted?
Well, a lot, a resident would say. But how many is a lot? Heavy pollution levels can stretch for weeks, leaving locals to grouse over hot pot about how the smog seems to last forever. Then a crisp, blue-sky day comes with the western wind, and it’s all forgotten.
China Real Time crunched the recent release of historical data on Beijing pollution from the U.S. State Department, which it gathered from a monitor installed at the U.S. Embassy there in 2008. First we crunched those hourly readings into daily averages. Then we converted those readings to match a widely used air-quality index and compared it to U.S. standards for air quality, which tell the public whether the air quality is good — or not good — for a person’s health.
The results aren’t pretty. Based on data collected for 2,028 days between April 2008 and March 2014, only 25 days were considered “good” by U.S. standards.
Good, on the index, is a reading of 50 or below. The U.S. Environmental Protection Agency says readings of below 100 on the index are “satisfactory.” But by that U.S. standard, Beijing isn’t satisfactory, either.
Beijing’s air-quality index has averaged above 100 for 1,632 days — or about fourth-fifths of the time — since April 2008. Based on Chinese standards, the air-quality index has averaged above 100 for 1,105 days — or a bit more than half of the time.
There are caveats of course. The data aren’t scientific because they stem from only one air-monitoring station in one location in the city. Chinese officials have many more monitors throughout the city and country, but they beefed up monitoring only relatively recently.
Still, the data offer a guide to how frequently the Chinese capital’s skies get dirty – as well as a useful comparison between Chinese and U.S. standards.
China has its own standard for what constitutes a “good” or a “hazardous” day. When China Real Time held the data to the Chinese standard, it found 380 “good” days over the same period.
The wide discrepancy is because the U.S. has tighter standards for concentrations of PM2.5 — tiny particulate matter measuring less than 2.5 microns in length that are harmful to human health. The U.S. limit for a “good” day is a PM2.5 concentration of no more than 12 micrograms per cubic meter. By comparison, China’s limit for a “good” day is 34 micrograms per cubic meter.
The biggest discrepancy between the U.S. and China are days that are “unhealthy for sensitive groups.” Based on U.S. standards, 979 days — roughly half the days surveyed — were in this category. Based on Chinese standards, there were only 245 days in this category.
Sensitive groups are people with respiratory or heart disease, the elderly and children, according to the EPA. Health effects on them include the increasing likelihood of respiratory symptoms, aggravation of heart or lung disease and premature mortality, the EPA says.
The U.S. and China both agree on days that were “very unhealthy” and “hazardous.” Of the more than 2,000 days surveyed, about 311 days were “very unhealthy” and about 94 days were “hazardous.”
- .U.S. Treasury looks to hold more cash to deal with future crises
- .Yum, McDonald's in Shanghai food safety investigation
- .Yellen defends loose Fed policy, says job market still too weak
- .Carl Icahn says 'time to be cautious' on U.S. stocks
- .Samsung Electronics says second quarter profit likely down 24.5 percent; worst in two years
- .U.S. jobs data seen reinforcing strong growth outlook
- .Asia stocks up on buoyant Wall Street, oil near highs